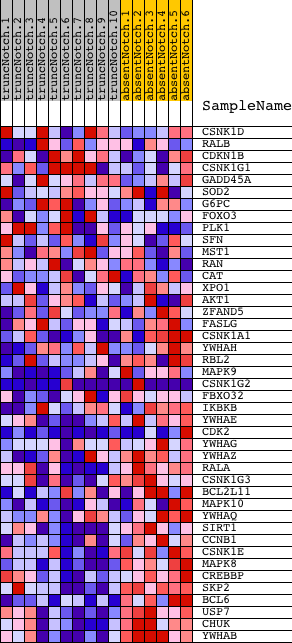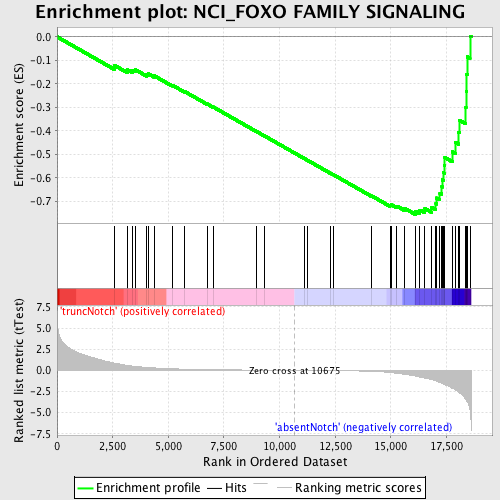
Profile of the Running ES Score & Positions of GeneSet Members on the Rank Ordered List
| Dataset | Set_03_absentNotch_versus_truncNotch.phenotype_absentNotch_versus_truncNotch.cls #truncNotch_versus_absentNotch |
| Phenotype | phenotype_absentNotch_versus_truncNotch.cls#truncNotch_versus_absentNotch |
| Upregulated in class | absentNotch |
| GeneSet | NCI_FOXO FAMILY SIGNALING |
| Enrichment Score (ES) | -0.7552612 |
| Normalized Enrichment Score (NES) | -1.8608599 |
| Nominal p-value | 0.0 |
| FDR q-value | 0.0105668465 |
| FWER p-Value | 0.0070 |
| PROBE | DESCRIPTION (from dataset) | GENE SYMBOL | GENE_TITLE | RANK IN GENE LIST | RANK METRIC SCORE | RUNNING ES | CORE ENRICHMENT | |
|---|---|---|---|---|---|---|---|---|
| 1 | CSNK1D | 4280280 4480167 6450600 | 2575 | 0.866 | -0.1211 | No | ||
| 2 | RALB | 6130397 | 3152 | 0.591 | -0.1402 | No | ||
| 3 | CDKN1B | 3800025 6450044 | 3383 | 0.512 | -0.1422 | No | ||
| 4 | CSNK1G1 | 840082 1230575 3940647 | 3503 | 0.469 | -0.1391 | No | ||
| 5 | GADD45A | 2900717 | 4034 | 0.346 | -0.1606 | No | ||
| 6 | SOD2 | 1410053 | 4092 | 0.335 | -0.1569 | No | ||
| 7 | G6PC | 430093 | 4365 | 0.289 | -0.1657 | No | ||
| 8 | FOXO3 | 2510484 4480451 | 5175 | 0.186 | -0.2055 | No | ||
| 9 | PLK1 | 1780369 2640121 | 5726 | 0.143 | -0.2322 | No | ||
| 10 | SFN | 6290301 7510608 | 6744 | 0.087 | -0.2852 | No | ||
| 11 | MST1 | 1400403 | 7014 | 0.077 | -0.2981 | No | ||
| 12 | RAN | 2260446 4590647 | 8979 | 0.029 | -0.4033 | No | ||
| 13 | CAT | 4280152 | 9333 | 0.023 | -0.4218 | No | ||
| 14 | XPO1 | 540707 | 11124 | -0.008 | -0.5181 | No | ||
| 15 | AKT1 | 5290746 | 11234 | -0.010 | -0.5237 | No | ||
| 16 | ZFAND5 | 6770673 | 12271 | -0.030 | -0.5789 | No | ||
| 17 | FASLG | 2810044 | 12425 | -0.034 | -0.5864 | No | ||
| 18 | CSNK1A1 | 2340427 | 14138 | -0.115 | -0.6763 | No | ||
| 19 | YWHAH | 1660133 2810053 | 14963 | -0.251 | -0.7156 | No | ||
| 20 | RBL2 | 580446 1400670 | 15024 | -0.267 | -0.7134 | No | ||
| 21 | MAPK9 | 2060273 3780209 4070397 | 15263 | -0.341 | -0.7193 | No | ||
| 22 | CSNK1G2 | 3060095 4730037 | 15605 | -0.459 | -0.7283 | No | ||
| 23 | FBXO32 | 110037 610750 | 16106 | -0.670 | -0.7417 | Yes | ||
| 24 | IKBKB | 6840072 | 16300 | -0.784 | -0.7362 | Yes | ||
| 25 | YWHAE | 5310435 | 16530 | -0.911 | -0.7301 | Yes | ||
| 26 | CDK2 | 130484 2260301 4010088 5050110 | 16838 | -1.088 | -0.7246 | Yes | ||
| 27 | YWHAG | 3780341 | 17025 | -1.251 | -0.7093 | Yes | ||
| 28 | YWHAZ | 1230717 | 17058 | -1.283 | -0.6850 | Yes | ||
| 29 | RALA | 2680471 | 17205 | -1.431 | -0.6640 | Yes | ||
| 30 | CSNK1G3 | 110450 | 17294 | -1.527 | -0.6378 | Yes | ||
| 31 | BCL2L11 | 780044 4200601 | 17311 | -1.546 | -0.6073 | Yes | ||
| 32 | MAPK10 | 6110193 | 17369 | -1.612 | -0.5778 | Yes | ||
| 33 | YWHAQ | 6760524 | 17409 | -1.661 | -0.5463 | Yes | ||
| 34 | SIRT1 | 1190731 | 17426 | -1.676 | -0.5132 | Yes | ||
| 35 | CCNB1 | 4590433 4780372 | 17775 | -2.121 | -0.4890 | Yes | ||
| 36 | CSNK1E | 2850347 5050093 6110301 | 17912 | -2.315 | -0.4495 | Yes | ||
| 37 | MAPK8 | 2640195 | 18042 | -2.526 | -0.4053 | Yes | ||
| 38 | CREBBP | 5690035 7040050 | 18081 | -2.625 | -0.3542 | Yes | ||
| 39 | SKP2 | 360711 380093 4810368 | 18370 | -3.435 | -0.3002 | Yes | ||
| 40 | BCL6 | 940100 | 18384 | -3.485 | -0.2303 | Yes | ||
| 41 | USP7 | 3990356 | 18411 | -3.592 | -0.1590 | Yes | ||
| 42 | CHUK | 7050736 | 18443 | -3.743 | -0.0849 | Yes | ||
| 43 | YWHAB | 1740176 | 18560 | -4.653 | 0.0030 | Yes |